YourTwitterSentiment
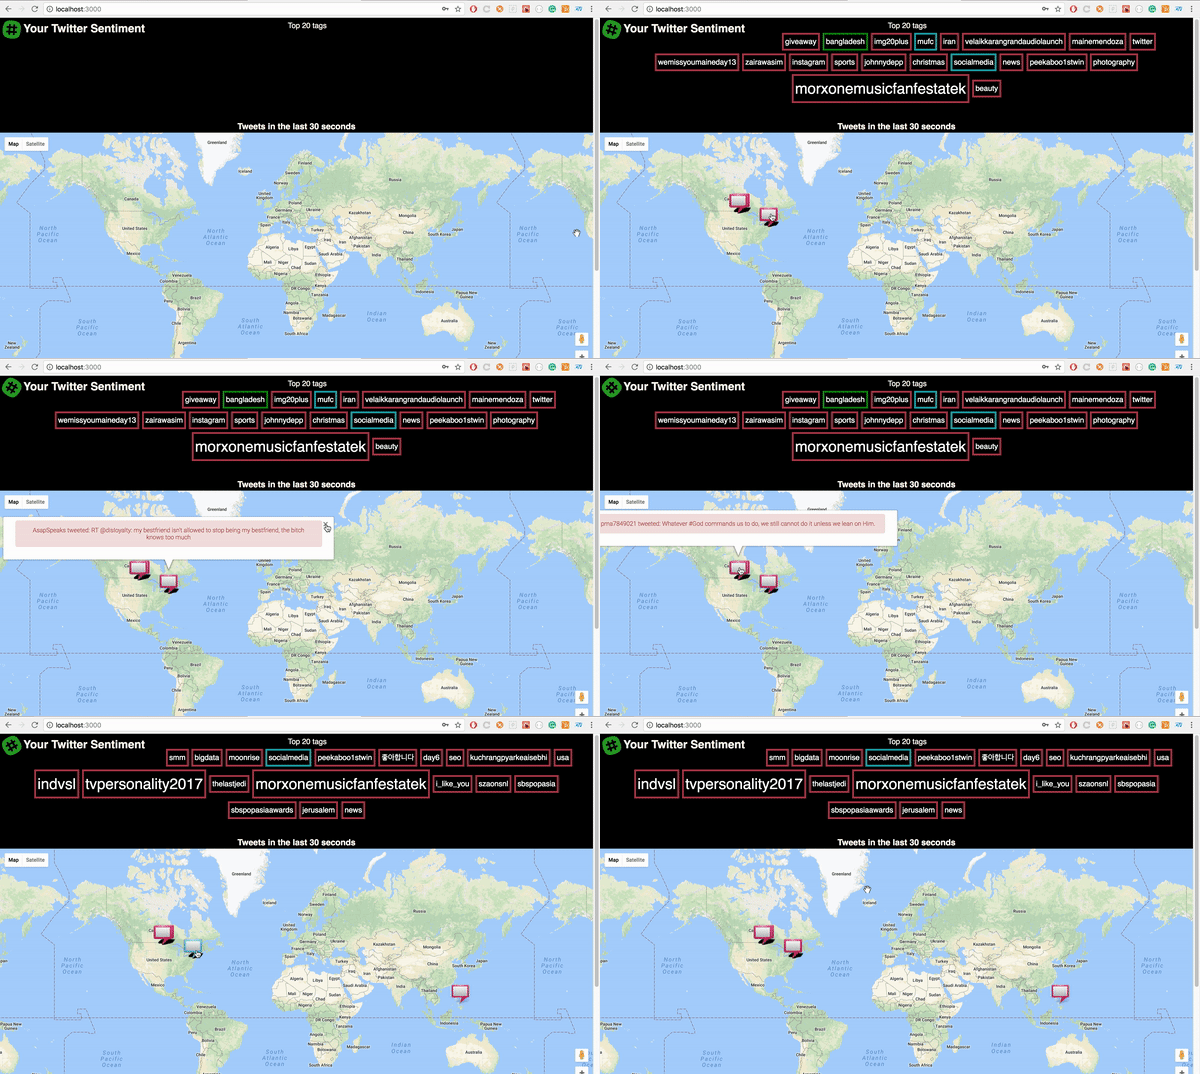
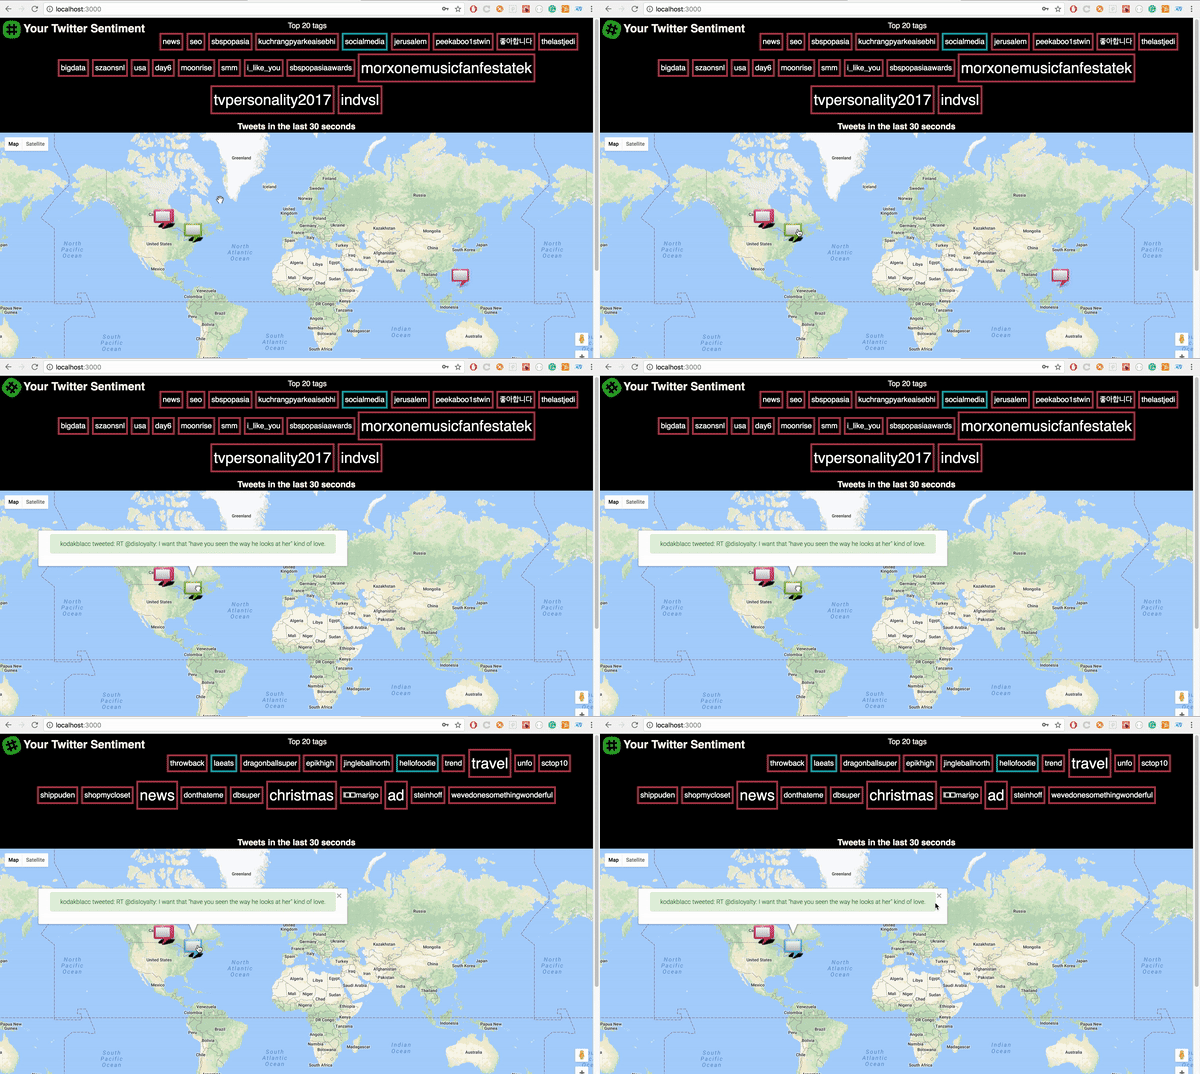
A pet project to analyze live twitter stream for the tweets-sentiment and top 20 hashtags with their sentiment. Tweets in the last 30 seconds (configuarable) are visualized on the world map with their associated sentiment and popular hashtags are visualized as a tag-cloud. Each tag size represents number of tweets that included the tag and its color represent the average sentiment - Red for Negative, Blue for neutral and green for positive. Tweets on map can be filtered for a specific tag from the cloud.
Applications
This project can be used as a base for various applications:
- Monitoring customer comments of a particular brand/service,
- Clustering different types of customers based on location,
- General purpose usage to identify “what’s hot right now!” and many other use cases.
Sentiment Analysis
Each tweet is classified as either Positive, Neutral or Negative based on its text and tag is calssified based on the average sentiment in the last 30 seconds. Any model among Naive Bayes, Random Forest and Multilayer perceptron can be used to classify tweets. (Change to desired model in Application.conf)
Demo
Sentiment by user

- Tweets showing the user and his negative sentiment tweet.

- Tweets showing the user and his positive sentiment tweet
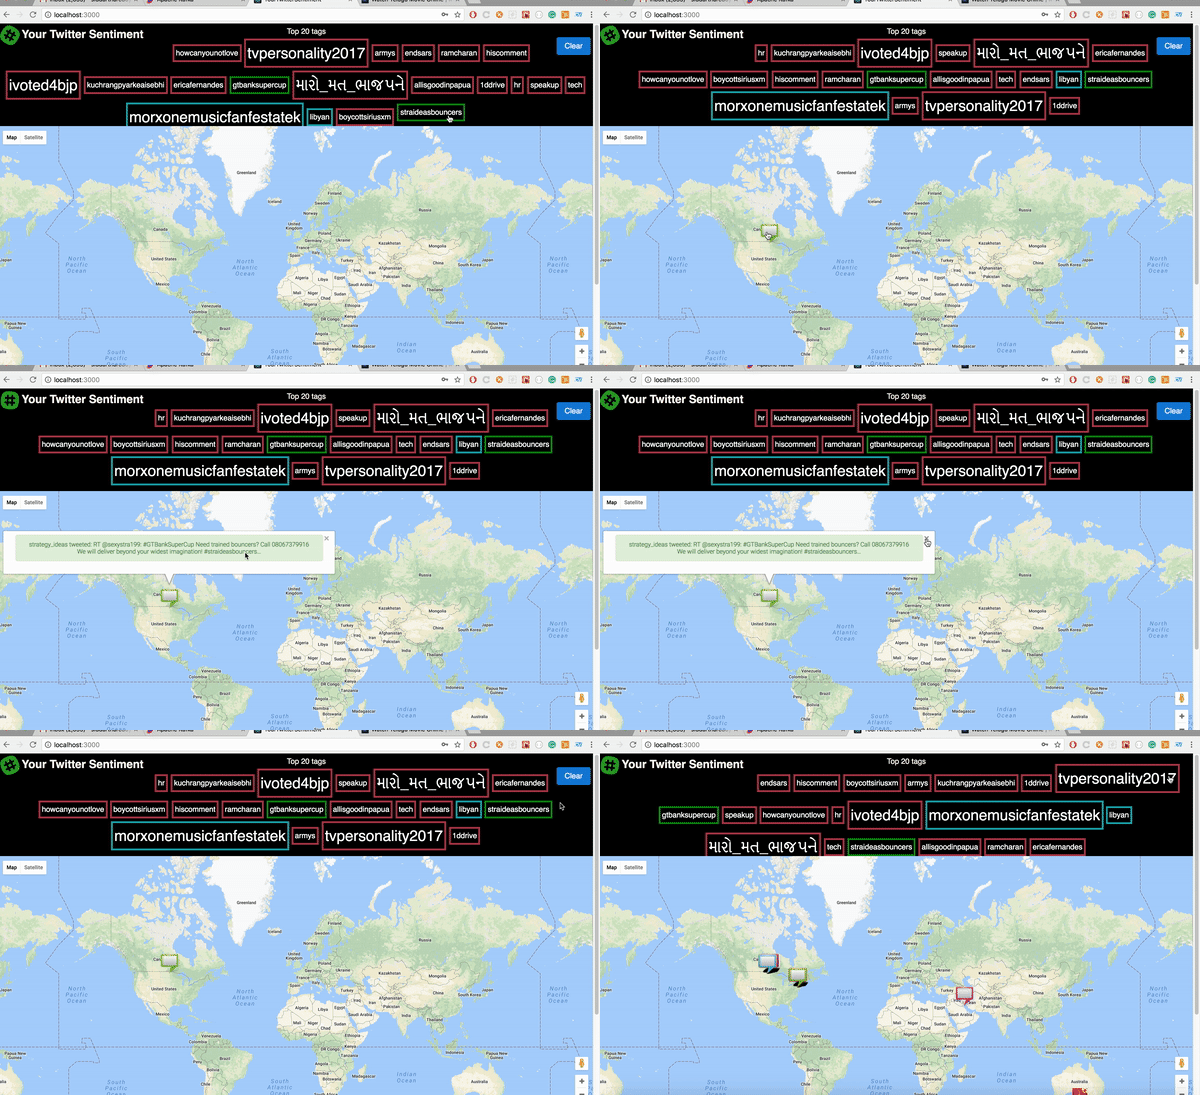
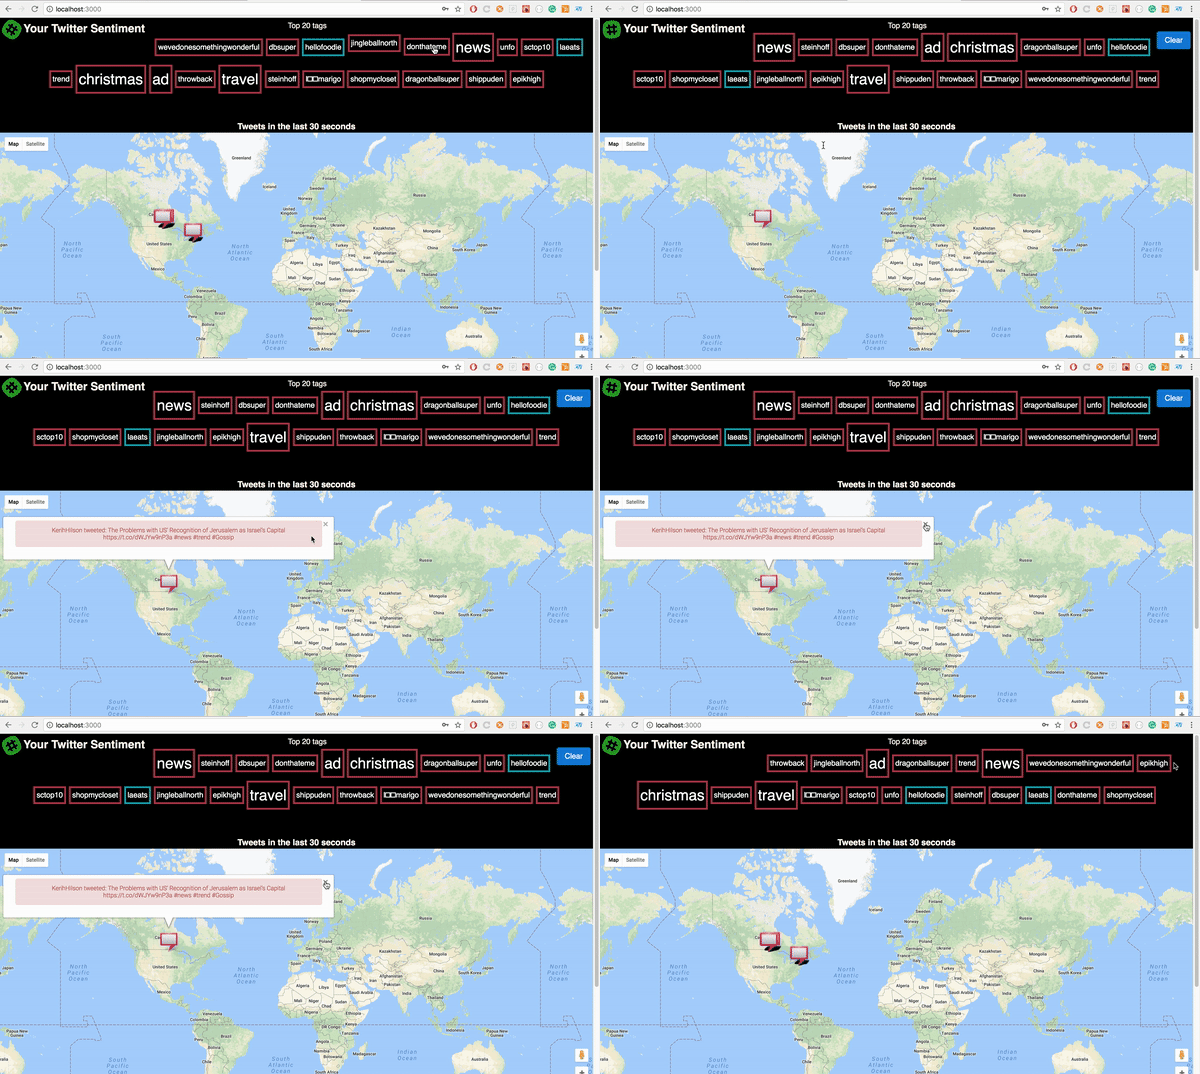
Sentiment by tag

- Filtering by tag gives your desired tweets on the map.

- Filtering tweets with ‘news’ tags.
Built With
- Apache Spark
- Spark ML
- Apache Kafka
- Stanford Core NLP library
- React
- Redux
- Express
- Socket IO
- Node Kafka
Coming Up
- Incorporate user’s choice to narrow down analysis to a specific topic. Ex: Particular brand.